Search in scripts for "3 ema"

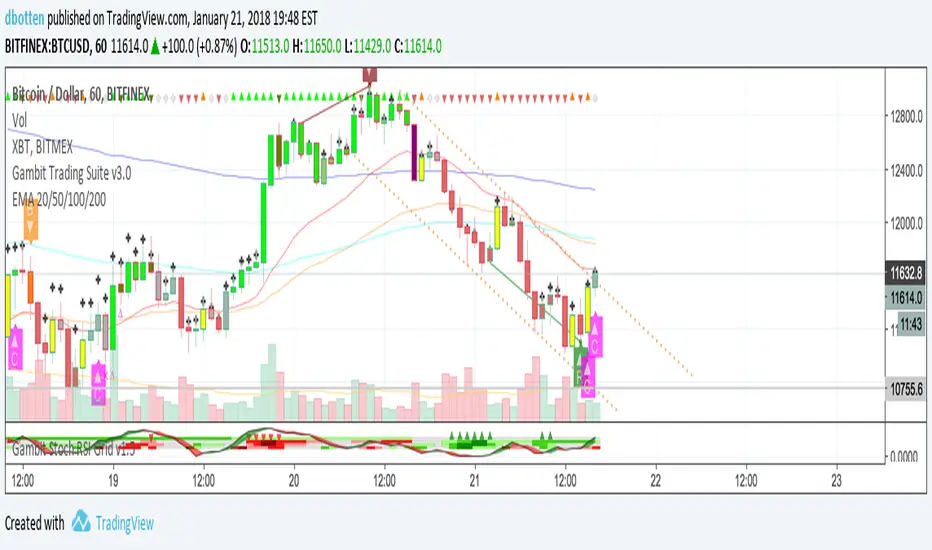
EMA 20/50/100/200Plots exponential moving average on four timeframes at once for rapid indication of momentum shift as well as slower-moving confirmations.
Displays EMA 20, 50, 100, and 200... default colors are hotter for faster timeframes, cooler for slower ones
Three EMAThree simple plotted ema lines all with a slightly different variable as well as calculation method.

EMA SpreadExponential Moving Average Spread is the percentage spread difference between EMA1 (Slow) and EMA2 (Fast) ie. the gap between two indicators slow and fast. Useful when used alongside EMA cross, MACD, and RSI to strengthen buy/sell signals.

MAX EMA FibonacciVisualizza in un unico indicatore fino a 5 EMA, di default è impostata la serie di Fibonacci (21,55,69,144,233)

Double EMAThis indicator drops to EMA on your chart. by default it's using different number of bars to calculate the short and long range indicators per time frame. This system is wildly used by professionals to avoid false reading on market's trend and better make decisions. Remember, the crossing of these two indicators should not be used for getting a signal. Instead, you can look into long indicator to see the global market's trend and look at short indicator if the market is reversing the direction of trend to avoid false signals by other systems you may use.
There is also an input and when you check mark the check box, you can tweak the numbers and the two custom numbers will totally override the default ones to make it suite your needs.
Bunch of EMAThere isn't any fancy stuff here, just bunch of EMA to add, remove and change setting easily.

Triple EMA difference colors - GcNaif PandorraTriple EMA difference colors
* choose colors on your choice
* choose wave count on your choice

B3 EMA RibbonAs a person versed in other languages of script, I am sharing my first pinescript. I have just thrown together some EMA lines and testing out the fill() function. I have some 400+ indicators I could make and share, so cheers to many more! As I get more versed in the language, I will make more intricate studies based on high math and sound strategy.

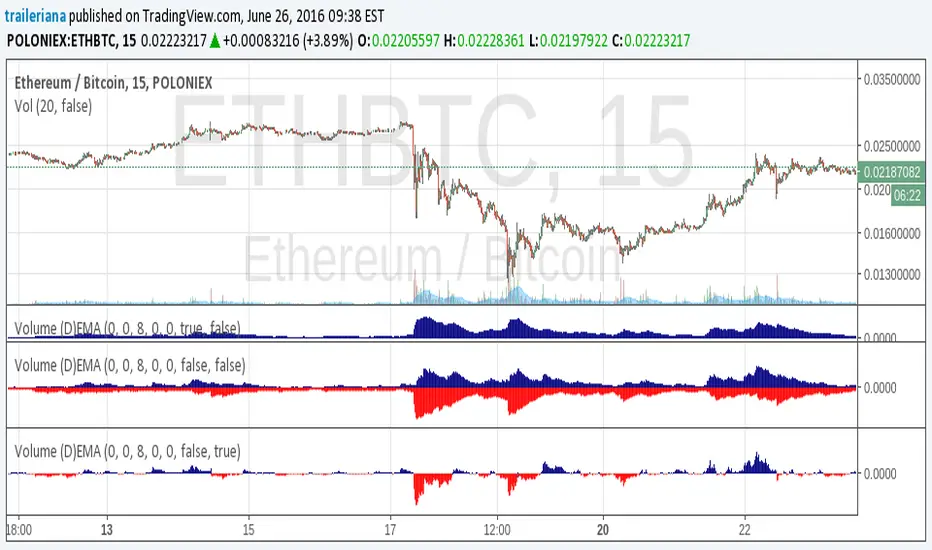
Volume (D)EMAA simple yet configurable indicator that shows recent traffic volumes.
The time period is specified as weeks/days/hours/minutes, not as bars.
For using the generalized double EMA, set the velocity to something other than zero.
Single Timeframe EMAThis plots EMAs from higher timeframes on intraday charts. Very useful for finding areas of S/R

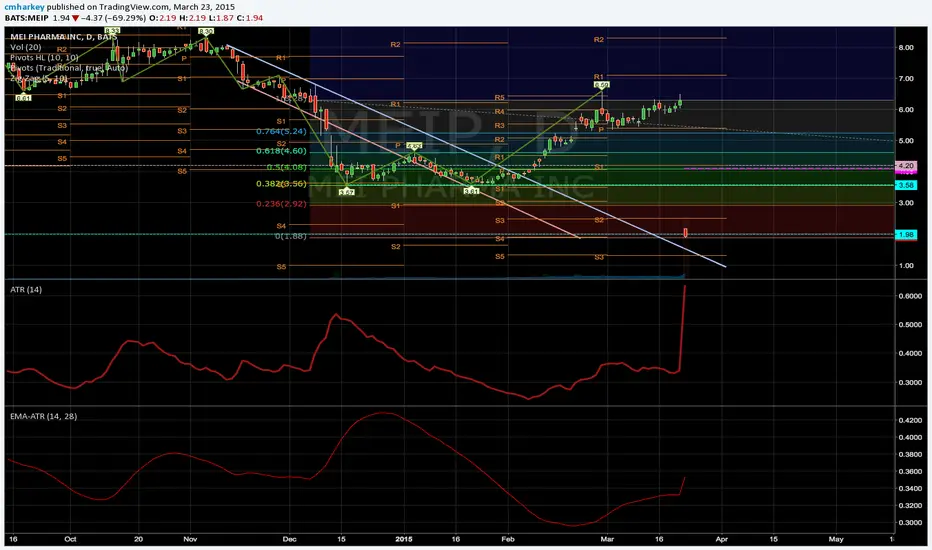
Moving Average of Average True Range - EMA ATRSo I came across the need of wanting to smooth out the ATR of something that has some violent swings in it in order to better place some stops.
Simply put the output of the ATR into the EMA function.
Everything is labeled easily in the settings window you you can clearly change period length for each function.
EMA Wave Indicator [LazyBear]This is a 3 EMA visualization tool. Relative momentum across 3 timeframes are rendered as A/B/C waves. Also, helpful in identifying spike/exhaustion bars.
When all the waves are in the same direction, the momentum is very high on that direction. I have made all options configurable, have fun tuning for your instrument :)
Complete list of all my indicators:
docs.google.com

Infinite EMA with Alpha Control♾️ Infinite EMA with Alpha Control
What Makes This EMA "Infinite"?
Unlike traditional EMA indicators that are limited to typical periods (1-5000), this Infinite EMA breaks all boundaries. You can create EMAs with periods of 1,000, 10,000, or even 1,000,000 bars - that's why it's called "infinite"! Also Infinite EMA starts working immediately from the very first bar on your chart
Why This EMA is "Infinite":
1. Mathematically: When N → ∞, alpha → 0, meaning infinitely long "memory"
2. Practically: You can set any period - even 100,000 bars
3. Flexibility: Alpha allows precise control over the "forgetting speed"
How Does It Work?
The magic lies in the Alpha parameter. While regular EMAs use fixed formulas, this indicator gives you direct control over the EMA's "memory" through Alpha values:
• High Alpha (0.1-0.2): Fast reaction, short memory
• Medium Alpha (0.01-0.05): Balanced response
• Low Alpha (0.0001-0.001): Extremely slow reaction, very long memory
• Ultra-low Alpha (0.000001): Almost frozen in time
The Mathematical Formula:
Alpha = 2 / (Period + 1)
This means you can achieve any EMA period by adjusting Alpha, giving you infinite flexibility!
Expanded "Infinite EMA" Table:
Period EMA (N) - Alpha (Rounded) - Alpha (Exact) - Description
10 - 0.1818 - 0.181818... - Fast EMA
20 - 0.0952 - 0.095238... - Short-term
50 - 0.0392 - 0.039215... - Medium-term
100 - 0.0198 - 0.019801... - Long-term
200 - 0.0100 - 0.009950... - Standard long-term
500 - 0.0040 - 0.003996... - Very long-term
1,000 - 0.0020 - 0.001998... - Super long-term
2,000 - 0.0010 - 0.000999... - Ultra long-term
5,000 - 0.0004 - 0.000399... - Mega long-term
10,000 - 0.0002 - 0.000199... - Giga long-term
25,000 - 0.00008 - 0.000079... - Century-scale EMA
50,000 - 0.00004 - 0.000039... - Practically motionless
100,000 - 0.00002 - 0.000019... - "Glacial" EMA
500,000 - 0.000004 - 0.000003... - Geological timescale
1,000,000 - 0.000002 - 0.000001... - Approaching constant
5,000,000 - 0.0000004 - 0.0000003... - Virtually static
10,000,000 - 0.0000002 - 0.0000001... - Nearly flat line
100,000,000 - 0.00000002 - 0.00000001... - Mathematical infinity
Formula: Alpha = 2/(N+1) where N is the EMA period
Key Features:
Dual EMA System: Run fast and slow EMAs simultaneously
Crossover Signals: Automatic buy/sell signals with customizable alerts
Alpha Control: Direct mathematical control over EMA behavior
Infinite Periods: From 1 to 100,000,000+ bars
Visual Customization: Colors, fills, backgrounds, signal sizes
Instant Start: Works accurately from the very first bar
Update Intervals: Control calculation frequency for noise reduction
Why Choose Infinite EMA?
1. Unlimited Flexibility: Any period you can imagine
2. Mathematical Precision: Direct alpha control for exact behavior
3. Professional Grade: Suitable for all trading styles
4. Easy to Use: Simple settings with powerful results
5. No Warm-up Period: Accurate values from bar #1
Simple Explanation:
Think of EMA as a "memory system":
• High Alpha = Short memory (forgets quickly, reacts fast)
• Low Alpha = Long memory (remembers everything, moves slowly)
With Infinite EMA, you can set the "memory length" to anything from seconds to centuries!
⚡ Instant Start Feature - EMA from First Bar
Immediate Calculation from Bar #1
Unlike traditional EMA indicators that require a "warm-up period" of N bars before showing accurate values, Infinite EMA starts working immediately from the very first bar on your chart.
How It Works:
Traditional EMA Problem:
• Standard 200-period EMA: Needs 200+ bars to become accurate
• First 200 bars: Shows incorrect/unstable values
• Result: Large portions of historical data are unusable
Infinite EMA Solution:
Bar #1: EMA = Current Price (perfect starting point)
Bar #2: EMA = Alpha × Price + (1-Alpha) × Previous EMA
Bar #3: EMA = Alpha × Price + (1-Alpha) × Previous EMA
...and so on
Key Benefits:
No Warm-up Period: Start trading signals from day one
Full Chart Coverage: Every bar has a valid EMA value
Historical Accuracy: Backtesting works on entire dataset
New Markets: Works perfectly on newly listed assets
Short Datasets: Effective even with limited historical data
Practical Impact:
Scenario Traditional EMA Infinite EMA
New cryptocurrency Unusable for first 200 days ✅ Works from day 1
Limited data (< 200 bars) Inaccurate values ✅ Fully functional
Backtesting Must skip first 200 bars ✅ Test entire history
Real-time trading Wait for stabilization ✅ Trade immediately
Technical Implementation:
if barstate.isfirst
EMA := currentPrice // Perfect initialization
else
EMA := alpha × currentPrice + (1-alpha) × previousEMA
This smart initialization ensures mathematical accuracy from the very first calculation, eliminating the traditional EMA "ramp-up" problem.
Why This Matters:
For Backesters: Use 100% of available data
For Live Trading: Get signals immediately on any timeframe
For Researchers: Analyze complete datasets without gaps
Bottom Line: Infinite EMA is ready to work the moment you add it to your chart - no waiting, no warm-up, no exceptions!
Unlike traditional EMAs that require a "warm-up period" of 200+ bars before showing accurate values, Infinite EMA starts working immediately from bar #1.
This breakthrough eliminates the common problem where the first portion of your chart shows unreliable EMA data. Whether you're analyzing a newly listed cryptocurrency, working with limited historical data, or backtesting strategies, every single bar provides mathematically accurate EMA values.
No more waiting periods, no more unusable data sections - just instant, reliable trend analysis from the moment you apply the indicator to any chart.
🔄 Update Interval Bars Feature
The Update Interval feature allows you to control how frequently the EMA recalculates, providing flexible noise filtering without changing the core mathematics.
Set to 1 for standard behavior (updates every bar), or increase to 5-10 for smoother signals that update less frequently. Higher intervals reduce market noise and false signals but introduce slightly more lag. This is particularly useful on volatile timeframes where you want the EMA's directional bias without every minor price fluctuation affecting the calculation.
Perfect for swing traders who prefer cleaner, more stable trend lines over hyper-responsive indicators.
Conclusion
The Infinite EMA transforms the traditional EMA from a fixed-period tool into a precision instrument with unlimited flexibility. By understanding the Alpha-Period relationship, traders can create custom EMAs that perfectly match their trading style, timeframe, and market conditions.
The "infinite" nature comes from the ability to set any period imaginable - from ultra-fast 2-bar EMAs to glacially slow 10-million-bar EMAs, all controlled through a single Alpha parameter.
________________________________________
Whether you're a beginner looking for simple trend following or a professional researcher analyzing century-long patterns, Infinite EMA adapts to your needs. The power of infinite periods is now in your hands! 🚀
Go forward to the horizon. When you reach it, a new one will open up.
- J. P. Morgan

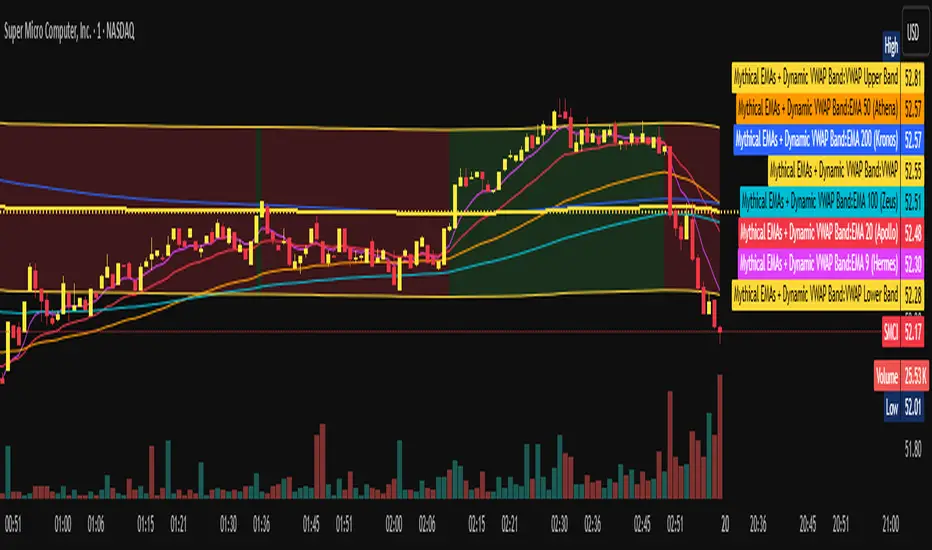
Mythical EMAs + Dynamic VWAP BandThis indicator titled "Mythical EMAs + Dynamic VWAP Band." It overlays several volatility-adjusted Exponential Moving Averages (EMAs) on the chart, along with a Volume Weighted Average Price (VWAP) line and a dynamic band around it.
Additionally, it uses background coloring (clouds) to visualize bullish or bearish trends, with intensity modulated by the price's position relative to the VWAP.
The EMAs are themed with mythical names (e.g., Hermes for the 9-period EMA), but this is just stylistic flavoring and doesn't affect functionality.
I'll break it down section by section, explaining what each part does, how it works, and its purpose in the context of technical analysis. This indicator is designed for traders to identify trends, momentum, and price fairness relative to volume-weighted averages, with volatility adjustments to make the EMAs more responsive in volatile markets.
### 1. **Volatility Calculation (ATR)**
```pine
atrLength = 14
volatility = ta.atr(atrLength)
```
- **What it does**: Calculates the Average True Range (ATR) over 14 periods (a common default). ATR measures market volatility by averaging the true range (the greatest of: high-low, |high-previous close|, |low-previous close|).
- **Purpose**: This volatility value is used later to dynamically adjust the EMAs, making them more sensitive in high-volatility conditions (e.g., during market swings) and smoother in low-volatility periods. It helps the indicator adapt to changing market environments rather than using static EMAs.
### 2. **Custom Mythical EMA Function**
```pine
mythical_ema(src, length, base_alpha, vol_factor) =>
alpha = (2 / (length + 1)) * base_alpha * (1 + vol_factor * (volatility / src))
ema = 0.0
ema := na(ema ) ? src : alpha * src + (1 - alpha) * ema
ema
```
- **What it does**: Defines a custom function to compute a modified EMA.
- It starts with the standard EMA smoothing factor formula: `2 / (length + 1)`.
- Multiplies it by a `base_alpha` (a user-defined multiplier to tweak responsiveness).
- Adjusts further for volatility: Adds a term `(1 + vol_factor * (volatility / src))`, where `vol_factor` scales the impact, and `volatility / src` normalizes ATR relative to the source price (making it scale-invariant).
- The EMA is then calculated recursively: If the previous EMA is NA (e.g., at the start), it uses the current source value; otherwise, it weights the current source by `alpha` and the prior EMA by `(1 - alpha)`.
- **Purpose**: This creates "adaptive" EMAs that react faster in volatile markets (higher alpha when volatility is high relative to price) without overreacting in calm periods. It's an enhancement over standard EMAs, which use fixed alphas and can lag in choppy conditions. The mythical theme is just naming—functionally, it's a volatility-weighted EMA.
### 3. **Calculating the EMAs**
```pine
ema9 = mythical_ema(close, 9, 1.2, 0.5) // Hermes - quick & nimble
ema20 = mythical_ema(close, 20, 1.0, 0.3) // Apollo - short-term foresight
ema50 = mythical_ema(close, 50, 0.9, 0.2) // Athena - wise strategist
ema100 = mythical_ema(close, 100, 0.8, 0.1) // Zeus - powerful oversight
ema200 = mythical_ema(close, 200, 0.7, 0.05) // Kronos - long-term patience
```
- **What it does**: Applies the custom EMA function to the close price with varying lengths (9, 20, 50, 100, 200 periods), base alphas (decreasing from 1.2 to 0.7 for longer periods to make shorter ones more responsive), and volatility factors (decreasing from 0.5 to 0.05 to reduce volatility influence on longer-term EMAs).
- **Purpose**: These form a multi-timeframe EMA ribbon:
- Shorter EMAs (e.g., 9 and 20) capture short-term momentum.
- Longer ones (e.g., 200) show long-term trends.
- Crossovers (e.g., short EMA crossing above long EMA) can signal buy/sell opportunities. The volatility adjustment makes them "mythical" by adding dynamism, potentially improving signal quality in real markets.
### 4. **VWAP Calculation**
```pine
vwap_val = ta.vwap(close) // VWAP based on close price
```
- **What it does**: Computes the Volume Weighted Average Price (VWAP) using the built-in `ta.vwap` function, anchored to the close price. VWAP is the average price weighted by volume over the session (resets daily by default in Pine Script).
- **Purpose**: VWAP acts as a benchmark for "fair value." Prices above VWAP suggest bullishness (buyers in control), below indicate bearishness (sellers dominant). It's commonly used by institutional traders to assess entry/exit points.
### 5. **Plotting EMAs and VWAP**
```pine
plot(ema9, color=color.fuchsia, title='EMA 9 (Hermes)')
plot(ema20, color=color.red, title='EMA 20 (Apollo)')
plot(ema50, color=color.orange, title='EMA 50 (Athena)')
plot(ema100, color=color.aqua, title='EMA 100 (Zeus)')
plot(ema200, color=color.blue, title='EMA 200 (Kronos)')
plot(vwap_val, color=color.yellow, linewidth=2, title='VWAP')
```
- **What it does**: Overlays the EMAs and VWAP on the chart with distinct colors and titles for easy identification in TradingView's legend.
- **Purpose**: Visualizes the EMA ribbon and VWAP line. Traders can watch for EMA alignments (e.g., all sloping up for uptrend) or price interactions with VWAP.
### 6. **Dynamic VWAP Band**
```pine
band_pct = 0.005
vwap_upper = vwap_val * (1 + band_pct)
vwap_lower = vwap_val * (1 - band_pct)
p1 = plot(vwap_upper, color=color.new(color.yellow, 0), title="VWAP Upper Band")
p2 = plot(vwap_lower, color=color.new(color.yellow, 0), title="VWAP Lower Band")
fill_color = close >= vwap_val ? color.new(color.green, 80) : color.new(color.red, 80)
fill(p1, p2, color=fill_color, title="Dynamic VWAP Band")
```
- **What it does**: Creates a band ±0.5% around the VWAP.
- Plots the upper/lower bands with full transparency (color opacity 0, so lines are invisible).
- Fills the area between them dynamically: Semi-transparent green (opacity 80) if close ≥ VWAP (bullish bias), red if below (bearish bias).
- **Purpose**: Highlights deviations from VWAP visually. The color change provides an at-a-glance sentiment indicator—green for "above fair value" (potential strength), red for "below" (potential weakness). The narrow band (0.5%) focuses on short-term fairness, and the fill makes it easier to spot than just the line.
### 7. **Trend Clouds with VWAP Interaction**
```pine
bullish = ema9 > ema20 and ema20 > ema50
bearish = ema9 < ema20 and ema20 < ema50
bullish_above_vwap = bullish and close > vwap_val
bullish_below_vwap = bullish and close <= vwap_val
bearish_below_vwap = bearish and close < vwap_val
bearish_above_vwap = bearish and close >= vwap_val
bgcolor(bullish_above_vwap ? color.new(color.green, 50) : na, title="Bullish Above VWAP")
bgcolor(bullish_below_vwap ? color.new(color.green, 80) : na, title="Bullish Below VWAP")
bgcolor(bearish_below_vwap ? color.new(color.red, 50) : na, title="Bearish Below VWAP")
bgcolor(bearish_above_vwap ? color.new(color.red, 80) : na, title="Bearish Above VWAP")
```
- **What it does**: Defines trend conditions based on EMA alignments:
- Bullish: Shorter EMAs stacked above longer ones (9 > 20 > 50, indicating upward momentum).
- Bearish: The opposite (downward momentum).
- Sub-conditions combine with VWAP: E.g., bullish_above_vwap is true only if bullish and price > VWAP.
- Applies background colors (bgcolor) to the entire chart pane:
- Strong bullish (above VWAP): Green with opacity 50 (less transparent, more intense).
- Weak bullish (below VWAP): Green with opacity 80 (more transparent, less intense).
- Strong bearish (below VWAP): Red with opacity 50.
- Weak bearish (above VWAP): Red with opacity 80.
- If no condition matches, no color (na).
- **Purpose**: Creates "clouds" for trend visualization, enhanced by VWAP context. This helps traders confirm trends—e.g., a strong bullish cloud (darker green) suggests a high-conviction uptrend when price is above VWAP. The varying opacity differentiates signal strength: Darker for aligned conditions (trend + VWAP agreement), lighter for misaligned (potential weakening or reversal).
### Overall Indicator Usage and Limitations
- **How to use it**: Add this to a TradingView chart (e.g., stocks, crypto, forex). Look for EMA crossovers, price bouncing off EMAs/VWAP, or cloud color changes as signals. Bullish clouds with price above VWAP might signal buys; bearish below for sells.
- **Strengths**: Combines momentum (EMAs), volume (VWAP), and volatility adaptation for a multi-layered view. Dynamic colors make it intuitive.
- **Limitations**:
- EMAs lag in ranging markets; volatility adjustment helps but doesn't eliminate whipsaws.
- VWAP resets daily (standard behavior), so it's best for intraday/session trading.
- No alerts or inputs for customization (e.g., changeable lengths)—it's hardcoded.
- Performance depends on the asset/timeframe; backtest before using.
- **License**: Mozilla Public License 2.0, so it's open-source and modifiable.
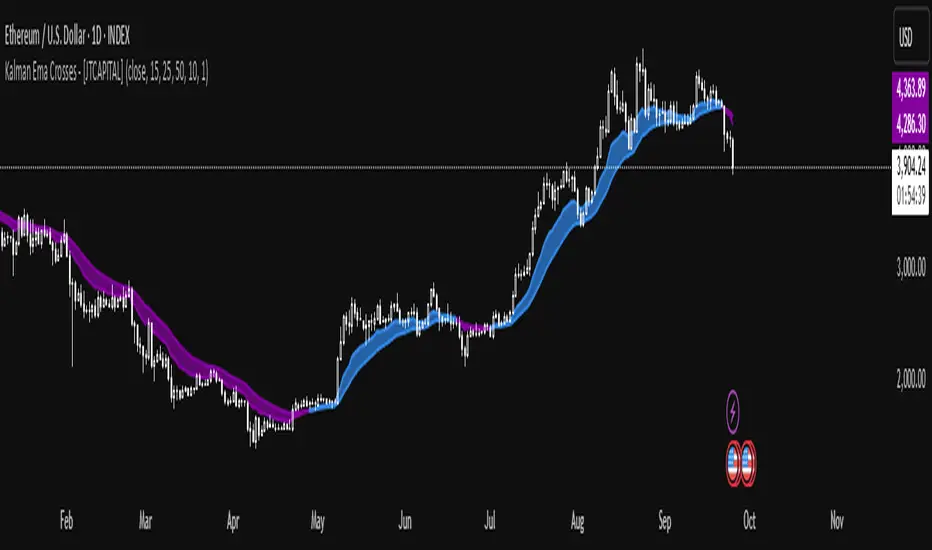
Kalman Ema Crosses - [JTCAPITAL]Kalman EMA Crosses - is a modified way to use Kalman Filters applied on Exponential Moving Averages (EMA Crosses) for Trend-Following.
The Kalman filter is a recursive smoothing algorithm that reduces noise from raw price or indicator data, and in this script it is applied both directly to price and on top of EMA calculations. The goal is to create cleaner, more reliable crossover signals between two EMAs that are less prone to false triggers caused by volatility or market noise.
The indicator works by calculating in the following steps:
Source Selection
The script starts by selecting the price input (default is Close, but can be adjusted). This chosen source is the foundation for all further smoothing and EMA calculations.
Kalman Filtering on Price
Depending on user settings, the selected source is passed through one of two independent Kalman filters. The filter takes into account process noise (representing expected market randomness) and measurement noise (representing uncertainty in the price data). The Kalman filter outputs a smoothed version of price that minimizes noise and preserves underlying trend structure.
EMA Calculation
Two exponential moving averages (EMA 1 and EMA 2) are then computed on the Kalman-smoothed price. The lengths of these EMAs are fully customizable (default 15 and 25).
Kalman Filtering on EMA Values
Instead of directly using raw EMA curves, the script applies a second layer of Kalman filtering to the EMA values themselves. This step significantly reduces whipsaw behavior, creating smoother crossovers that emphasize real momentum shifts rather than temporary volatility spikes.
Trend Detection via EMA Crossovers
-A bullish trend is detected when EMA 1 (fast) crosses above EMA 2 (slow).
-A bearish trend is detected when EMA 1 crosses below EMA 2.
The detected trend state is stored and used to dynamically color the plots.
Visual Representation
Both EMAs are plotted on the chart. Their colors shift to blue during bullish phases and purple during bearish phases. The area between the two EMAs is filled with a shaded region to clearly highlight trending conditions.
Buy and Sell Conditions :
- Buy Condition : When the Kalman-smoothed EMA 1 crosses above the Kalman-smoothed EMA 2, a bullish crossover is confirmed.
- Sell Condition : When EMA 1 crosses below EMA 2, a bearish crossover is confirmed.
Users may enhance the robustness of these signals by adjusting process noise, measurement noise, or EMA lengths. Lower measurement noise values make the filter react faster (but potentially noisier), while higher values make it smoother (but slower).
Features and Parameters :
- Source : Selectable price input (Close, Open, High, Low, etc.).
- EMA 1 Length : Defines the fast EMA period.
- EMA 2 Length : Defines the slow EMA period.
- Process Noise : Controls how much randomness the Kalman filter assumes in price dynamics.
- Measurement Noise : Controls how much uncertainty is assumed in raw input data.
- Kalman Usage : Option to apply Kalman filtering either before EMA calculation (on price) or after (on EMA values).
Specifications :
Kalman Filter
The Kalman filter is an optimal recursive algorithm that estimates the state of a system from noisy measurements. In trading, it is used to smooth prices or indicator values. By balancing process noise (expected volatility) with measurement noise (data uncertainty), it generates a smoothed signal that reacts adaptively to market conditions.
Exponential Moving Average (EMA)
An EMA is a weighted moving average that emphasizes recent data more heavily than older data. This makes it more responsive than a simple moving average (SMA). EMAs are widely used to identify trends and momentum shifts.
EMA Crossovers
The crossing of a fast EMA above a slow EMA suggests bullish momentum, while the opposite suggests bearish momentum. This is a cornerstone technique in trend-following systems.
Dual Kalman Filtering
Applying Kalman both to raw price and to the EMAs themselves reduces whipsaws further. It creates crossover signals that are not only smoothed but also validated across two levels of noise reduction. This significantly enhances signal reliability compared to traditional EMA crossovers.
Process Noise
Represents the filter’s assumption about how much the underlying market can randomly change between steps. Higher values make the filter adapt faster to sudden changes, while lower values make it more stable.
Measurement Noise
Represents uncertainty in price data. A higher measurement noise value means the filter trusts the model more than the observed data, leading to smoother results. A lower value makes the filter more reactive to observed price fluctuations.
Trend Coloring & Fill
The use of dynamic colors and filled regions provides immediate visual recognition of trend states, helping traders act faster and with greater clarity.
Enjoy!